ChartGo Video Tutorials: Step-by-Step Guides for Creating Graphs
Discover how to create stunning charts with ease using our ChartGo video tutorials. Whether you’re a beginner or an experienced user, our step by step guides will help you easily learn every feature of ChartGo, from creating simple bar graphs to advanced data visualization techniques. Learn how to make the most out of ChartGo's powerful tools to create professional, customized charts more easily than ever.
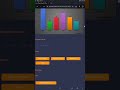
This tutorial video shows you how to create a graph using ChartGo. It shows the main options available when creating a graph and guides you through the whole process.
3 minutes
This tutorial guides on how to save a graph in ChartGo. This will allow you to come back to your graph at a later date so you can modify it.
3 minutes
This tutorial video shows you how to quickly import data from Excel or CSV files into ChartGo to create stunning charts in seconds!
3 minutes